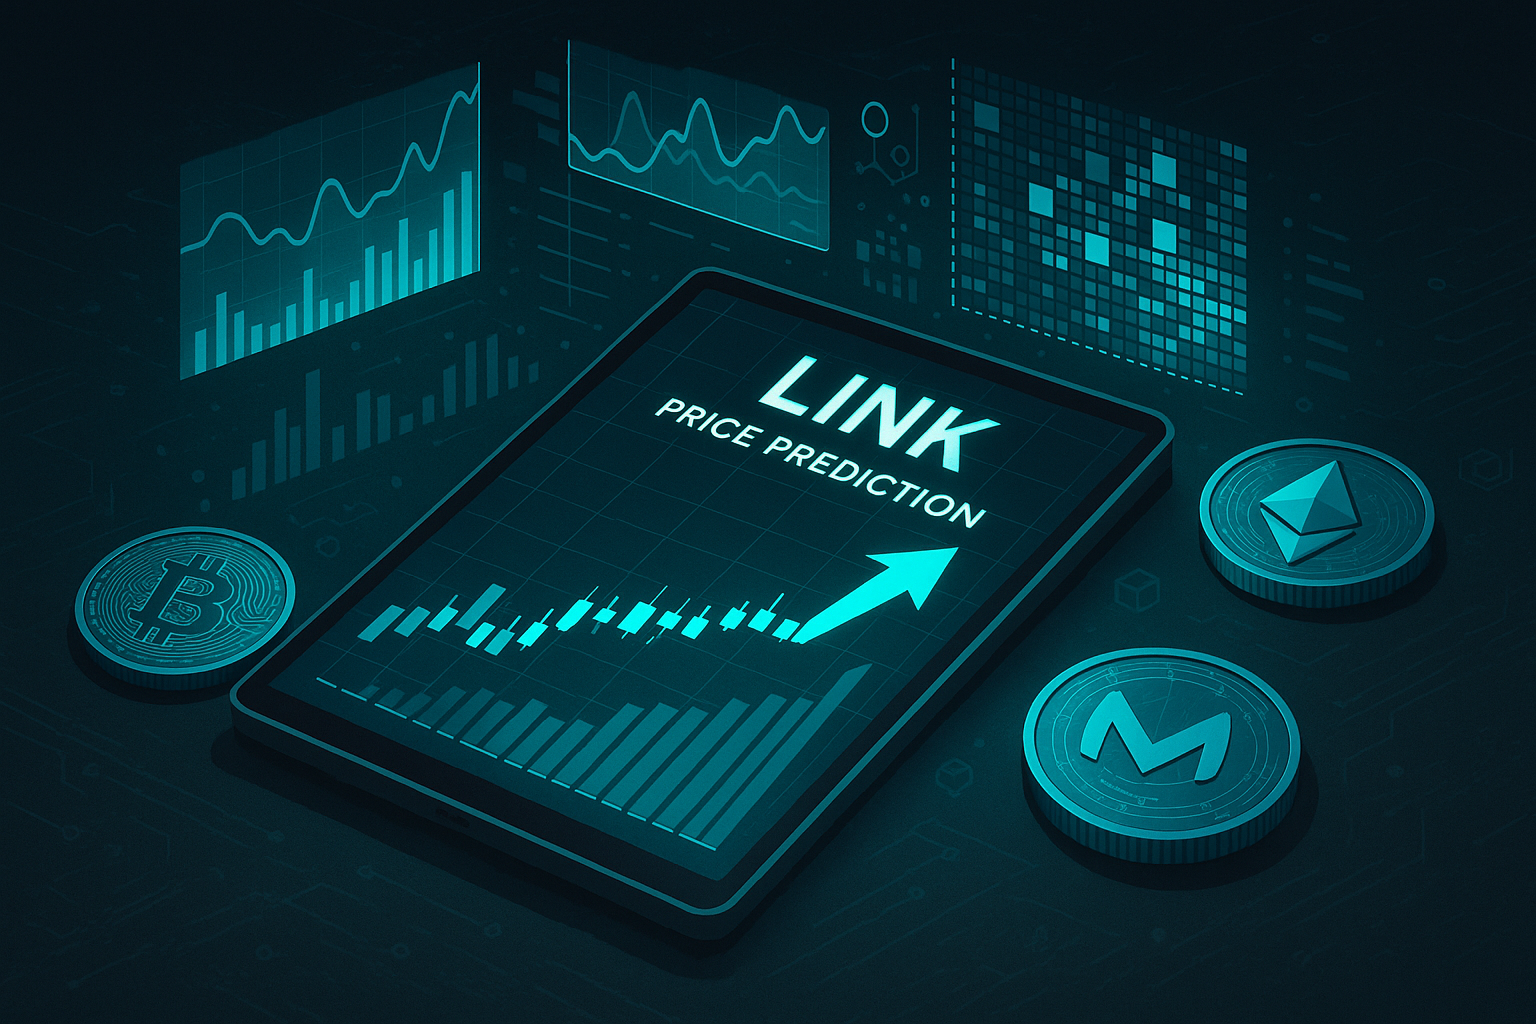
Chainlink Price Prediction 2026-2030: Can LINK Reclaim Its All‑Time High?
| Year | Low | Average | High |
|---|---|---|---|
| 2026 | $5.50 | $10.00 | $16.00 |
| 2027 | $7.00 | $13.50 | $22.00 |
| 2028 | $9.00 | $18.00 | $30.00 |
| 2029 | $11.00 | $24.00 | $40.00 |
| 2030 | $14.00 | $32.00 | $52.00 |
Chainlink’s current price is $7.85, far below its $52.70 all-time high, but it still powers a huge share of DeFi oracle infrastructure. Our LINK price prediction model sees a realistic path back toward the $50 region by 2030 in a strong crypto market, with significant volatility along the way. If you prefer to trade instead of just holding, you can swap LINK for BTC and other coins instantly on non-custodial platforms to react to these swings.
This is not financial advice. Cryptocurrency markets are volatile. Always do your own research before investing.

Chainlink Price Overview
As of 7 July 2026, Chainlink (LINK) is trading at $7.85 with a market capitalization of $5.88 billion, ranking it #20 among all cryptocurrencies by market cap. The 24-hour trading volume sits at $171.01 million, reflecting steady but not euphoric market interest.
Key market stats for quick reference:
- Current LINK price: $7.85
- Market cap: $5.88B (Rank #20)
- 24h volume: $171.01M
- All-time high (ATH): $52.70 on 10 May 2021
- All-time low (ATL): $0.1482 on 29 Nov 2017
- Circulating supply: 748.10M LINK
- Total / Max supply: 1.00B LINK
- Price change (24h): +0.40%
- Price change (7d): +9.47%
- Price change (30d): +2.06%
- Price change (1y): -41.83%
Chainlink is the leading decentralized oracle network. It connects smart contracts to off-chain data, APIs and real-world events, allowing decentralized applications to use reliable price feeds, randomness, and more. It is a core building block for DeFi, derivatives, insurance and many Web3 use cases.
For up-to-date metrics and charts, you can always cross-check Chainlink data on aggregators like CoinGecko or CoinMarketCap.
Chainlink Price History
Understanding LINK’s past performance helps put any Chainlink price prediction into context. Historically, LINK has gone through several distinct phases:
Early years: 2017-2018
Chainlink launched in 2017, with LINK initially trading near its all-time low of $0.1482 in November 2017. During the 2017 ICO boom, the token saw speculative interest but remained relatively under the radar compared with major L1 coins.
The 2018 bear market hit the entire crypto sector, yet LINK held up better than many smaller-cap tokens. Its value proposition as a “picks and shovels” infrastructure play for smart contracts began to gain traction.
First major breakout: 2019-2020
From 2019 onward, Chainlink partnerships with projects and enterprises helped fuel narrative and price action. Integrations with protocols like Aave, Synthetix and others, plus announcements of collaborations with Google Cloud and Oracle Corporation, highlighted its potential as critical middleware.
During the 2019-2020 period:
- LINK climbed from below $1 to above $10 during DeFi’s early growth.
- Each new “oracle integration” announcement often triggered upward price spikes.
- Chainlink became a default oracle solution for many new DeFi projects.
DeFi summer and all-time high: 2020-2021
The 2020 “DeFi summer” and subsequent 2021 bull run pushed LINK into the mainstream. As TVL in DeFi soared and derivatives, lending and AMM platforms expanded, demand for secure price oracles increased.
This culminated in LINK’s all-time high of $52.70 on 10 May 2021. At that time, Chainlink was widely perceived as the undisputed oracle leader and a top infrastructure bet.
Key drivers of the ATH:
- Explosive DeFi growth, requiring reliable on-chain price data.
- Speculative mania across altcoins in early 2021.
- Expanding Chainlink services like VRF (Verifiable Random Function) and Keepers.
Post-bull retrace and stagnation: 2022-2024
The 2022 bear market, DeFi liquidations, and widespread risk-off sentiment in global markets cut LINK’s price hard, along with most altcoins. Macroeconomic tightening, regulatory uncertainty and collapsing projects weighed on the entire ecosystem.
During this phase:
- LINK retraced heavily from ATH, trading mostly in the single-digit to low double-digit range.
- Despite price weakness, Chainlink kept expanding products (Cross-Chain Interoperability Protocol, staking, more data feeds).
- Competition from other oracle and data projects increased, but Chainlink retained dominant mindshare.
Recent performance: 2025-2026
Over the last year, LINK has dropped roughly 41.83%, even though the last 7 days show a positive 9.47% rebound. This divergence underlines how volatile and cyclical crypto remains.
We are in a phase where:
- Infrastructure coins like LINK are more tied to real protocol usage and fee generation.
- Speculative cycles still drive sharp rallies and corrections.
- The market is repricing many assets based on actual adoption instead of pure narratives.
All of this history feeds directly into any realistic LINK price prediction: the token is proven to be capable of large uptrends, but it can also underperform for long periods in weak macro or crypto conditions.
Chainlink Technical Analysis
On the technical side, LINK’s chart around $7-8 offers a useful framework for evaluating support, resistance and trend possibilities. Exact levels move over time, but we can describe a logical structure based on current price behavior and historical pivots.
Key support and resistance levels
Given the current price of $7.85, several zones stand out:
- Immediate support: The $6-7 region has often acted as a key demand zone. A sustained break below $6 could expose LINK to deeper retracements toward $5.50 or lower.
- First resistance: Around $9-10, where previous local tops and consolidation have occurred. This band is crucial for shifting sentiment from neutral to mildly bullish.
- Major resistance: The $15-20 zone, which aligns with previous high-volume price history. Breaking and holding above this range would significantly strengthen the medium-term bullish case.
- Macro resistance: The $35-50 region, close to the pre-ATH and ATH cluster, will likely require a broad crypto bull run and strong Chainlink fundamentals to be retested.
Moving averages and trend structure
While exact moving average values change daily, the current general picture for LINK in mid-2026 is:
- Short-term MAs (10-50 day): After a 7-day gain of 9.47%, lower-period moving averages are likely turning up, showing short-term momentum.
- Medium-term MAs (100-200 day): Given the 1-year price decline of over 40%, longer MAs are probably flattening or still slightly downward sloping, signaling a cautious or accumulation phase rather than a clear uptrend.
A classic technical trigger many traders watch is when the price reclaims and holds the 200-day moving average with increasing volume. That often precedes more sustainable rallies.
Momentum indicators (RSI/MACD) and patterns
Based on price behavior:
- RSI: The modest 30-day gain (+2.06%) with a recent 7-day spike suggests RSI may be moving from neutral toward mildly bullish. Values in the 40-60 range typically indicate consolidation; a sustained move above 60 would favor bullish continuation.
- MACD / trend: After prolonged downtrends, MACD crossovers on higher time frames (daily/weekly) are often early signals of accumulation or trend reversals.
- Chart patterns: LINK has historically formed long accumulation ranges before impulsive moves. Trading ranges between $5-10, followed by a breakout with high volume, could resemble earlier cycles.
Technical analysis is not a guarantee, but it helps anchor scenarios for our Chainlink price prediction, especially when combined with fundamentals and macro conditions.
Chainlink Price Prediction 2026
For 2026, we are already part way through the year, so this section covers a 12-month rolling view relative to the current price of $7.85. Our 2026 estimates balance fundamentals, market structure and historical volatility.
From the summary table:
- 2026 Low: $5.50
- 2026 Average: $10.00
- 2026 High: $16.00
Bull case for 2026
In a bullish 2026 scenario, several things could align:
- DeFi risk appetite returns, boosting on-chain activity, derivatives and lending.
- Chainlink’s staking, CCIP (cross-chain interoperability) and new data products drive higher protocol usage and fee flows.
- Macro conditions ease, with interest rates stabilizing or declining, prompting renewed inflows into crypto.
Under those circumstances, LINK could realistically test resistance in the $14-16 region. This assumes a roughly 80-100% upside from current price, which is conservative compared with previous cycle multiples but more realistic for a top-20 infrastructure asset.
Base case for 2026
In a neutral or base-case scenario:
- Crypto recovers gradually but without a full-blown bull market.
- Chainlink adoption continues, but competitive oracle and data solutions cap narrative upside.
- Regulation remains a manageable headwind rather than a binary risk.
In this setting, LINK may oscillate within a broad $7-13 channel, producing an average yearly price around $10. Range-bound trading opportunities would be plentiful, especially when using instant swap services to move between LINK and majors like BTC or stablecoins.
You can swap LINK for BTC, ETH, USDT and 1,500+ other coins on GhostSwap without KYC, which can be useful if you primarily trade these mid-range price swings.
Bear case for 2026
A bearish 2026 could play out if:
- Macro recession deepens, pushing risk assets lower.
- Crypto-specific shocks (major hacks, regulatory crackdowns) hit DeFi usage.
- Alternative oracle or data infrastructure captures meaningful market share.
In that environment, LINK could revisit the $5.50-6.00 support band and spend time below $8. Prolonged trading in this lower range would drag the annual average down, but still above the extreme lows of previous cycles unless conditions become much worse than expected.
Chainlink Price Prediction 2027
By 2027, another full market cycle may be in play, particularly if Bitcoin’s halving dynamics and institutional adoption keep influencing crypto markets.
Our 2027 estimates:
- 2027 Low: $7.00
- 2027 Average: $13.50
- 2027 High: $22.00
Bullish outlook for 2027
A strong 2027 for LINK would likely be driven by:
- Broad crypto bull cycle with altcoin rotation into infrastructure plays.
- Chainlink oracles powering a majority of high-TVL DeFi apps across multiple chains.
- Staking rewards and protocol fees making LINK more attractive to long-term holders.
In a robust bull market, a move to $20-22 is plausible. That would still be below the 2021 ATH, which leaves upside potential without assuming an unrealistically euphoric scenario.
Neutral scenario for 2027
In a more balanced scenario:
- Crypto remains cyclical but less explosive, with more correlation to tech stocks.
- Chainlink sustains dominance but margins compress as competition matures.
- Real-world assets (RWA), tokenized securities and institutional products use Chainlink, but adoption grows steadily rather than suddenly.
Here, LINK might trade between $9-18 for most of the year, with local tops and bottoms driven by market sentiment. An average around $13.50 reflects moderate growth from current levels.
Bearish risks into 2027
Risks to the downside include:
- Persistent regulatory overhang in key markets like the US or EU.
- Major security incident or exploit involving Chainlink data or infrastructure.
- Structural shift toward alternative data architectures that reduce reliance on a single oracle provider.
In such a case, LINK might struggle to stay above $7-9, with rallies sold as exit liquidity for long-term holders. Our conservative low of $7.00 assumes the project remains fundamentally intact even in poor conditions.
Chainlink Price Prediction 2028
By 2028, the market may be maturing around real revenue, cash-flowing protocols and institutional integration of blockchain infrastructure. Chainlink is well positioned to benefit if it holds its leadership.
Our 2028 projections:
- 2028 Low: $9.00
- 2028 Average: $18.00
- 2028 High: $30.00
Bull case: Re-rating as critical infrastructure
A strong 2028 could see:
- Tokenized real-world assets (bonds, equities, commodities) relying on Chainlink for price and settlement data.
- CCIP widely used for cross-chain messaging and asset transfers.
- LINK staking and fee mechanisms maturing into predictable yield-like returns.
If Chainlink cements itself as an “internet plumbing” layer for financial data, the market could re-rate LINK significantly. A test of the $28-30 band would still be below ATH but signal investor confidence in long-term cash flows.
Base case: Gradual but steady growth
In a moderate path:
- Adoption grows across multiple chains, but revenue scales slower than narratives.
- Competition keeps pricing power in check, but Chainlink remains the default solution for many builders.
- Crypto volatility declines relative to 2020-2022, compressing upside multiples.
Under this scenario, LINK might trade largely between $12-24, with the average around $18. Long-term holders could see solid, though not explosive, returns from today’s levels.
Bear case: Commoditization of oracle services
Downside risks in 2028:
- Oracle services become commoditized, reducing differentiation and token value capture.
- New architectures (e.g., trusted execution environments, off-chain compute networks) partially displace traditional price feeds.
- Regulatory burdens or compliance requirements make some institutions wary of integrating token-based infrastructure.
If these trends emerge, LINK might struggle to sustain prices much above $10-12. Our projected low at $9.00 assumes Chainlink remains relevant but less dominant than expected.
Chainlink Price Prediction 2029-2030
Longer-term forecasts are inherently more uncertain, but we can outline plausible scenarios for LINK into 2029 and 2030, based on adoption trends and how previous crypto cycles have unfolded.
From our table:
- 2029 Low: $11.00 | Average: $24.00 | High: $40.00
- 2030 Low: $14.00 | Average: $32.00 | High: $52.00
Macro bull case: Revisiting the ATH region
In the most optimistic but still realistic scenario, by 2029-2030:
- Global finance integrates blockchain rails extensively, with DeFi, RWAs and on-chain derivatives significantly larger than today.
- Chainlink oracles, randomness, CCIP and related services are deeply embedded across chains and institutions.
- Token economics (staking, rewards, fee distribution) align market value with protocol usage.
Under those conditions, LINK could reasonably approach or slightly undercut its previous ATH, trading in a $40-52 band at cycle peaks. Our 2030 high target of $52.00 basically represents a re-test of the ATH region, not an extreme breakout far beyond it.
Moderate long-term case: Sustainable infrastructure asset
A more conservative path sees Chainlink as:
- A leading, but not exclusive, oracle and data provider.
- A critical piece of Web3 infrastructure with steady but not explosive revenue.
- A token whose value is tied to future cash flows and network usage rather than pure speculation.
Here, LINK could settle into a long-term trading band between $20-40 by 2029-2030, with an average around $24 in 2029 and $32 in 2030. Returns would be meaningful from current prices but lower than early-cycle moonshots.
Bear case: Underperformance vs. broader crypto
Long-term downside scenarios include:
- Disruptive competition that either undercuts Chainlink on cost or offers superior tech.
- A shift toward permissioned, enterprise-only infrastructure that limits token value accrual.
- Prolonged “crypto winter” where the sector fails to break into mainstream use cases.
In these worlds, LINK might range mostly between $11-20 through 2029-2030, with upside spikes sold quickly. Our low estimates of $11.00 for 2029 and $14.00 for 2030 assume Chainlink continues to operate and innovate, but that market appetite for its token remains muted.
Is Chainlink a Good Investment?
Whether LINK is a good investment depends on your time horizon, risk tolerance and portfolio strategy. Here are the key pros, cons and risks to consider.
Strengths and upside drivers
- Clear value proposition: Chainlink solves a critical problem: bringing reliable off-chain data on-chain. DeFi, derivatives, insurance, gaming and RWAs all depend on accurate feeds.
- First-mover advantage: It is the most recognized and widely integrated oracle network. This network effect is hard for competitors to replicate quickly.
- Diverse product suite: Beyond price feeds, Chainlink offers VRF, Keepers, CCIP and more, increasing potential revenue streams.
- Strong ecosystem integration: Many leading protocols default to Chainlink, which can create sticky, long-term demand.
Weaknesses and key risks
- Token performance volatility: LINK has shown that it can lag broader markets for extended periods, despite solid fundamentals.
- Competition: Other oracle and data solutions are emerging, some with different architecture or incentives that might attract specific use cases.
- Regulatory uncertainty: Depending on how regulators classify tokens, LINK could face compliance and listing risk in certain jurisdictions.
- Complex token economics: The long-term balance between rewards, inflation and protocol revenue is still evolving, which can affect how much value LINK captures.
Who might consider holding LINK?
- Investors who believe oracles and data layers will be essential to the next wave of blockchain adoption.
- Crypto users comfortable with volatility and multi-year time horizons.
- DeFi participants who want exposure to infrastructure rather than only L1/L2 chains or applications.
Investors seeking short-term stability or guaranteed yield should approach LINK cautiously. Those who see it as a long-term infrastructure bet may find the current price below ATHs attractive, assuming Chainlink maintains its leadership.
What Experts Say About Chainlink
Analyst and expert opinions help round out any LINK price prediction. While perspectives vary, several recurring themes appear.
Infrastructure and DeFi focus
Many crypto analysts emphasize Chainlink’s role as a foundational DeFi component. For example, research pieces from major analytics platforms and institutional reports often categorize Chainlink within the “middleware” or “oracle” segment that underpins lending markets and derivatives.
These analysts generally argue that if DeFi scales, Chainlink’s services should see corresponding growth, though they caution that token value capture is not guaranteed without robust fee and staking models.
On-chain data and staking narratives
On-chain data and market commentary frequently highlight two narratives:
- Staking and rewards: Analysts have pointed out that the evolution of Chainlink staking could strengthen long-term holder incentives, potentially reducing circulating sell pressure over time.
- Usage-based valuation: Some valuation models try to estimate LINK’s fair value based on protocol revenues, data requests and transaction metrics, similar to how equities are assessed on cash flows.
Publicly available dashboards and analytics reports show that Chainlink continues to service a large number of protocols, reinforcing a generally constructive, though not unanimously bullish, expert view.
Balanced, not hype-driven, perspectives
More cautious commentators stress:
- The risk of competition compressing margins for oracle services.
- The possibility that some data and interoperability tasks move to alternative architectures.
- The need for clearer long-term token economics to justify very high valuations.
Overall, expert sentiment tends to recognize Chainlink as a high-quality, core infrastructure project, but with pricing that must be justified by continued adoption and revenue, not just narrative.
Factors That Could Affect LINK Price
Several macro, sector-specific and project-level drivers will shape any future Chainlink price prediction.
1. Crypto market cycles and macro conditions
- Interest rates and liquidity: Higher rates reduce speculative capital flowing into crypto. Looser monetary policy often correlates with renewed risk appetite.
- Bitcoin dominance: In early bull cycles, BTC strength can overshadow altcoins. Later, capital often rotates into infrastructure and DeFi tokens like LINK.
- Global risk sentiment: Recessions, geopolitical events and stock market crashes can all dampen crypto valuations, including LINK.
2. Adoption, partnerships and protocol usage
- DeFi TVL and volume: Growing total value locked and transaction volume in DeFi protocols that use Chainlink tends to support demand for its services.
- Enterprise and institutional use: Corporate partnerships, especially those using Chainlink for RWAs or financial infrastructure, can support the long-term thesis.
- New integrations and chains: Supporting more blockchains and L2s broadens the addressable market for Chainlink services.
3. Competition in data and oracle markets
- Alternative oracle networks: Competing projects can undercut fees, offer specialized services or target niche ecosystems.
- Native chain solutions: Some L1s and L2s develop in-house oracle solutions, which might reduce reliance on external providers.
- Cross-chain messaging rivals: CCIP competes with other interoperability protocols; outcomes here will influence market share.
4. Technology upgrades and tokenomics
- Staking expansions: Increasing staking caps, rewards and features can encourage more LINK to be locked, potentially reducing available supply on the market.
- Protocol revenue and fee sharing: How much value flows back to token holders vs. node operators will affect investor appetite.
- Scalability and security advancements: Upgrades that improve performance, reliability, or developer experience can enhance Chainlink’s competitive moat.
5. Regulatory landscape
- Token classifications: If LINK is ever deemed a security in major jurisdictions, exchange listings and institutional access could be affected.
- DeFi regulation: Rules impacting decentralized exchanges, lending and derivatives will indirectly affect demand for oracles.
- KYC/AML requirements: While infrastructure tokens are less directly impacted than privacy coins, any broad clampdown can weigh on market sentiment.
These factors together will determine whether LINK tracks toward the higher or lower end of the price ranges set out in this article.
Ready to Trade Chainlink?
Swap LINK instantly on GhostSwap — no KYC, no registration, no hassle. Choose from over 1,500 cryptocurrency pairs and keep full control of your keys while you trade.
You can use a non-custodial swap to move between LINK and BTC or other major coins if you prefer to actively manage your Chainlink exposure based on your own analysis and risk tolerance. Platforms like GhostSwap function as a fast, private exchange layer for adjusting your position without opening an account.
Frequently Asked Questions
Will Chainlink reach $50 again?
Chainlink has already reached $52.70 in May 2021, so a return to the $50 region is not unprecedented. Our 2030 high estimate of around $52.00 suggests that, in a strong bull market with robust adoption, LINK could realistically revisit that area.
However, this outcome depends on:
- Sustained growth in DeFi, RWAs and cross-chain infrastructure.
- Chainlink maintaining its leadership in oracle and data services.
- Favorable macro and regulatory environments for crypto.
There is no guarantee LINK will reclaim $50, but it is within the realm of plausible long-term scenarios rather than a purely speculative moonshot.
Is Chainlink a good long-term investment?
Chainlink can be a compelling long-term investment for those who:
- Believe oracles and data layers will remain essential to Web3 and on-chain finance.
- Are comfortable with multi-year holding periods and high volatility.
- Prefer infrastructure projects with real utility over purely speculative tokens.
On the other hand, LINK may not be suitable for:
- Investors seeking stable or guaranteed returns.
- Those with very short time horizons who are sensitive to 50%+ drawdowns.
Diversification, position sizing and ongoing research are key. Any Chainlink price prediction should be just one input into your broader investment strategy.
What will LINK be worth in 2030?
Based on the scenarios outlined in this article, our illustrative 2030 Chainlink price prediction is:
- Low: $14.00
- Average: $32.00
- High: $52.00
The $32 average assumes moderate adoption growth and Chainlink retaining a leading position, but not total dominance. The high case around $52 implies a significant bull market and strong usage of Chainlink’s full product suite.
Remember that forecasts this far out are speculative. Crypto markets can overshoot both to the upside and downside relative to any model.
Where can I buy/swap Chainlink?
You can get Chainlink on most major centralized and decentralized exchanges. If you want to swap tokens quickly without creating an account, a non-custodial platform is often more convenient.
On GhostSwap, you can swap crypto instantly between LINK and BTC or 1,500+ other trading pairs without KYC or registration. You simply connect a wallet, choose your input and output assets, confirm the transaction, and receive your LINK (or other coin) directly in your address.
Always verify contract addresses and use reputable platforms. Store your LINK in a secure wallet where you control the private keys.
Is Chainlink better than other oracle or data coins?
“Better” depends on your criteria. Chainlink currently offers:
- The most established brand and largest integration footprint among oracle networks.
- A broad suite of services beyond simple price feeds.
- A large and active community, plus significant developer adoption.
Competitor coins may claim advantages in specific niches, such as:
- Lower costs or different incentive structures.
- Specialization in certain ecosystems or data types.
- Alternative technical architectures.
For investors, the key question is whether Chainlink’s network effects, partnerships and product roadmap will continue to justify its valuation compared with rivals. It is often sensible to compare fundamentals, adoption metrics and token economics across multiple projects before deciding where to allocate capital.
In summary, our Chainlink price prediction for 2026-2030 sees a realistic path for LINK to gradually recover and potentially revisit its previous highs if adoption and market conditions cooperate. As always, do your own research, manage risk responsibly, and consider using non-custodial tools like GhostSwap to adjust your LINK exposure as the market evolves.