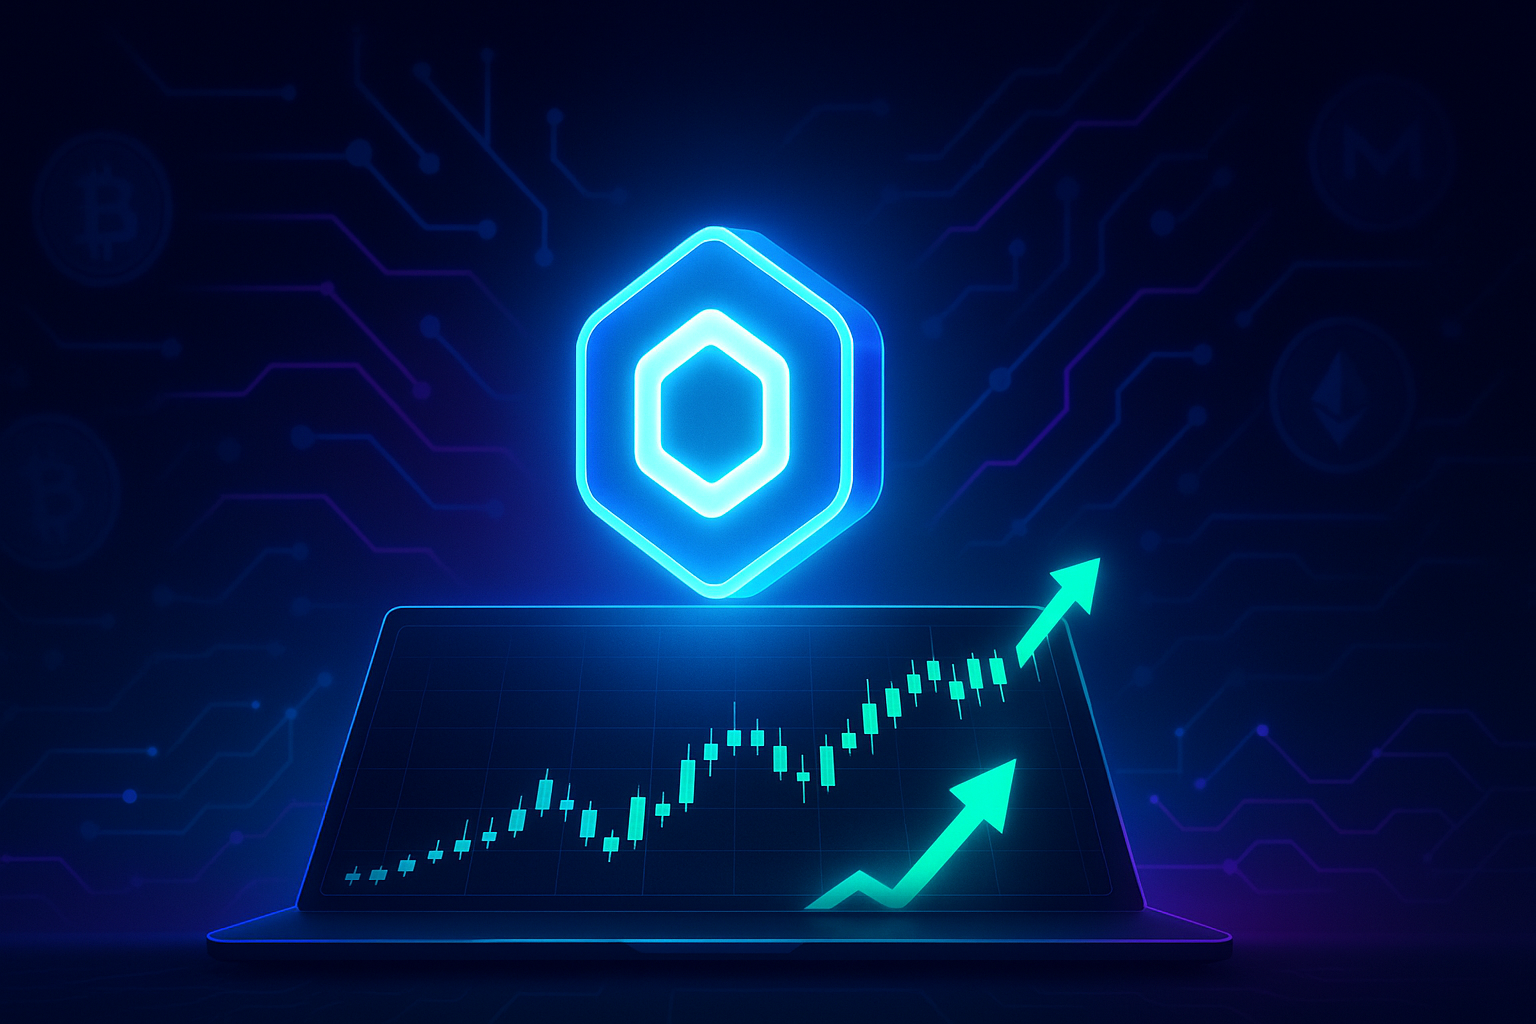
Chainlink Price Prediction 2026-2030: Can LINK Regain Its All-Time High?
| Year | Low | Average | High |
|---|---|---|---|
| 2026 | $7.50 | $12.00 | $18.00 |
| 2027 | $10.00 | $16.00 | $24.00 |
| 2028 | $12.00 | $20.00 | $32.00 |
| 2029 | $14.00 | $26.00 | $40.00 |
| 2030 | $18.00 | $34.00 | $52.00 |
This LINK price prediction for 2026-2030 suggests a gradual recovery from the current $9.03 level, with a realistic path back toward the previous all-time high near $52 by 2030 in a strong bull scenario. These targets assume continued Chainlink adoption as the leading oracle network, a healthy crypto market cycle, and successful rollout of staking and Chainlink Economics 2.0. If you want to position early or rebalance, you can swap LINK to BTC instantly with no account and no KYC on GhostSwap.
Disclaimer: This is not financial advice. Cryptocurrency markets are volatile. Always do your own research before investing.

Chainlink Price Overview
As of 6 April 2026, Chainlink (LINK) is trading at $9.03, with a market capitalization of about $6.57 billion, ranking it #17 among all cryptocurrencies by market cap. Its 24-hour trading volume stands at $261.04 million, indicating healthy liquidity and active market participation.
Key market stats for LINK today:
- Current price: $9.03
- Market cap: $6.57B
- 24h volume: $261.04M
- All-time high (ATH): $52.70 on 10 May 2021
- All-time low (ATL): $0.1482 on 29 November 2017
- Circulating supply: 727.10M LINK
- Total / max supply: 1.00B LINK
- 1-year price change: -28.35%
Chainlink is the leading decentralized oracle network that connects blockchains to real-world data, APIs, payments, and off-chain computation. It underpins core infrastructure for DeFi, derivatives, gaming, and institutional tokenization by providing secure, verifiable data feeds such as price oracles.
Without reliable oracles, smart contracts cannot interact safely with external data. Chainlink solves this problem by using a network of independent node operators and robust cryptoeconomic incentives. This foundational utility is central to any long-term LINK price prediction.
Chainlink Price History
Understanding LINK’s past market behavior helps contextualize realistic targets for 2026-2030.
Early days and pre-DeFi era (2017-2019)
Chainlink launched in 2017, with LINK initially trading around a few cents. The all-time low of $0.1482 was recorded in November 2017.
From 2018 through early 2019, LINK traded mostly below $1, with occasional speculative spikes. The market had not yet fully priced in the future importance of oracle networks, and DeFi was still nascent.
DeFi boom and exponential growth (2020-2021)
The turning point came with the DeFi explosion on Ethereum in 2020. Lending protocols, DEXs, derivatives platforms, and synthetic asset projects began relying on Chainlink price feeds for accurate on-chain data.
Key milestones in this period:
- Mid-2020: LINK breaks above $10 for the first time, as TVL in DeFi surges and Chainlink integrations multiply.
- 2020-early 2021: Chainlink becomes the de facto standard oracle for many major DeFi projects.
- 10 May 2021: LINK hits its all-time high of $52.70, riding both the broader crypto bull market and DeFi mania.
This period established Chainlink as critical infrastructure rather than a speculative side project, which underpins many longer-term bullish LINK price forecasts.
Bear market and consolidation (2021-2023)
After the May 2021 peak, crypto markets entered a prolonged bear phase. Several factors affected LINK:
- Macro tightening (rising interest rates) pressured risk assets across the board.
- DeFi growth slowed, and several high-profile protocol failures reduced speculative appetite.
- Competition from newer oracle and data solutions increased investor scrutiny.
LINK retraced heavily along with the market, moving from the $50+ range down into single-digit prices at points in 2022 and 2023. However, the project continued shipping upgrades such as Chainlink Keepers, CCIP (Cross-Chain Interoperability Protocol), and early stages of staking.
Staking, CCIP and narrative shift (2023-2025)
From late 2022 onward, three structural themes began shaping the medium-term Chainlink outlook:
- Staking: The introduction and expansion of LINK staking increased potential token utility and created a partial supply sink.
- CCIP: Cross-chain interoperability became a core narrative in crypto, with Chainlink positioned as a neutral messaging and data layer across chains.
- Real-world assets (RWA): As institutions explored tokenization of RWAs, reliable oracles and data attestation gained new importance.
These technical and narrative shifts are key inputs to any LINK price prediction post-2025, as they could support a gradual rerating of the token if adoption persists.
Recent performance (2025-2026)
As of April 2026, LINK trades at $9.03, roughly:
- Down about 82% from the ATH of $52.70.
- Up massively from the ATL of $0.1482, indicating strong long-term growth despite drawdowns.
- Down 28.35% over the last year, reflecting the lingering impact of previous market cycles and macro uncertainty.
The current consolidation zone around $8-10 is a key pivot: it can either form a long-term accumulation base or break down if macro and sector headwinds intensify.
Chainlink Technical Analysis
Fundamental narratives drive long-term value, but traders also focus on technical analysis to time entries and exits. Based on the current $9.03 price and historical trading patterns, here is a high-level technical view.
Support and resistance levels
Approximate medium-term support and resistance zones (based on prior price action around similar levels):
- Immediate support: $8.00 to $8.50 zone. A loss of this range could open a move toward $7.00.
- Stronger support: $6.50-7.00, where prior consolidation and volume clusters have appeared in past cycles.
- First resistance: $10.50-11.00, which previously acted as support/resistance multiple times.
- Higher resistance: $14.00-15.00, then $20.00 as a psychological level and prior distribution zone.
A sustained weekly close above $15 would be a meaningful technical break, often cited in bullish LINK price predictions as a gateway to a more aggressive uptrend.
Moving averages and trend structure
While exact real-time EMAs and SMAs are not provided here, the following typical structure is common during prolonged consolidations after bear markets:
- Short-term MAs (e.g., 20D, 50D) frequently cross up and down, reflecting choppy price action.
- Mid-term MAs (100D, 200D) flatten, acting as dynamic resistance in the early stages and then as support once the trend reverses.
- A classic bullish signal is when the price holds above the 200D moving average for several weeks and shorter MAs cross above it.
For LINK, traders will watch closely for a sustained break above key moving averages, which would support a more confident bullish price forecast.
RSI and momentum
The Relative Strength Index (RSI) for LINK has historically moved between oversold (<30) and overbought (>70) zones during macro cycles:
- During deep bear phases, weekly RSI tends to bottom between 25-35, often marking long-term accumulation zones.
- During strong bull runs, RSI can stay above 60 for extended periods.
As of early 2026, with price around $9.03 and still far below ATH, the long-term RSI is likely neither extreme overbought nor extreme oversold. This neutral zone leaves room for a new trend to form in either direction, which is why LINK price prediction models often include both conservative and bullish scenarios for 2026-2030.
Chainlink Price Prediction 2026
For 2026, we start from the current spot price of $9.03 and consider possible market environments. The figures below are approximate scenarios, not guarantees.
- 2026 low: $7.50
- 2026 average: $12.00
- 2026 high: $18.00
Bullish scenario for 2026
In a bullish 2026, several conditions converge:
- Crypto market sentiment improves, possibly in the later stages of a new macro bull cycle.
- DeFi, RWA tokenization, and cross-chain protocols increase their reliance on Chainlink services.
- Staking adoption grows, locking a higher percentage of circulating LINK and reducing effective supply.
Under this scenario, LINK could:
- Break above the $15 resistance region.
- Test the upper range near $18, representing approximately a 2x from current levels.
This would still be modest compared with the prior ATH, but consistent with a recovery phase rather than full-blown euphoria.
Base-case scenario for 2026
In a neutral/base case:
- Macro conditions are mixed, with crypto recovering but not in an explosive mania.
- Chainlink continues to integrate with new protocols, but competition from alternative oracle and data solutions limits valuation expansion.
- Staking and CCIP adoption grow steadily but not exponentially.
In this environment, LINK might:
- Trade mostly between $9 and $14.
- Average around $12 across the year.
For traders, this kind of range-bound movement offers swing trading opportunities. You can swap LINK for BTC, ETH, USDT and 1,500+ other coins on GhostSwap without KYC if you are rebalancing within that range.
Bearish scenario for 2026
In a downside case:
- Macro risk-off events or new regulatory shocks hit the market.
- DeFi remains stagnant, and RWA adoption is slower than expected.
- Alternative oracle solutions erode some of Chainlink’s perceived moat.
Under these conditions, LINK could:
- Retest lower supports around $7.50.
- Struggle to sustain moves above $10-11.
This would likely correspond to broader altcoin weakness, not a Chainlink-specific collapse.
Chainlink Price Prediction 2027
Looking toward 2027, we factor in another 12 months of potential adoption and possible maturation of Chainlink Economics 2.0.
- 2027 low: $10.00
- 2027 average: $16.00
- 2027 high: $24.00
Drivers for 2027
Key elements that could shape the LINK price in 2027:
- Oracle dominance: If Chainlink maintains its role as the default oracle for major L1s and L2s, it strengthens the long-term bull case.
- Revenue and value capture: Clearer data on protocol fees and how much value ultimately accrues to stakers and token holders will influence valuations.
- Competition and fragmentation: If alternative oracle networks start gaining significant market share, it could compress LINK’s relative valuation.
In a strong market, LINK could trade consistently above $20, with spikes toward $24. In a moderate environment, it may hover closer to the $14-18 range.
Chainlink Price Prediction 2028
By 2028, Chainlink will either be deeply entrenched as critical infrastructure across multiple chains and industries, or the market will have started rotating to alternative data layers.
- 2028 low: $12.00
- 2028 average: $20.00
- 2028 high: $32.00
Potential catalysts by 2028
- Mature staking economy: If a significant portion of circulating LINK is staked and protocol revenue is transparent, valuations may be easier to model, potentially justifying higher multiples.
- Institutional RWA integration: Should large-scale tokenization of bonds, equities, or real estate occur, oracles will play a vital role in pricing and settlement.
- Chainlink as cross-chain hub: Widespread use of CCIP for secure cross-chain communication may position Chainlink as foundational to multichain infrastructure.
In a bullish world where these catalysts play out, LINK could work toward the $30+ region. In a slower world, it might consolidate in the high teens to low twenties.
You can use tools like GhostSwap to move between LINK and BTC or stablecoins quickly during these macro shifts, using a non-custodial swap route when you need to react without registration delays.
Chainlink Price Prediction 2029-2030
For 2029-2030, any LINK price prediction becomes increasingly speculative, but we can still outline plausible ranges based on trend extrapolation and fundamental scenarios.
- 2029 low: $14.00
- 2029 average: $26.00
- 2029 high: $40.00
- 2030 low: $18.00
- 2030 average: $34.00
- 2030 high: $52.00
Can LINK retest its ATH by 2030?
The previous all-time high was $52.70 in May 2021. Our upper 2030 scenario assumes LINK can approximately retest that level if:
- Chainlink remains the dominant oracle network across major L1s, L2s, and cross-chain environments.
- On-chain revenue and fee flows are substantial and credibly directed toward LINK stakers and/or token holders.
- The broader crypto market experiences at least one new large bull cycle before 2030.
Under that outcome, a $40-52 range by 2030 is not unreasonable as a high-end estimate. This would represent a roughly 4-5x from current price, over a 4-5 year horizon.
More conservative long-term scenario
In a more moderate trajectory:
- Chainlink remains important but shares the oracle market with other providers.
- Crypto market cycles are less explosive than 2017 or 2021.
- Regulation is strict but not destructive, slowing but not killing innovation.
In this world, LINK might:
- Trade mostly in the $20-35 zone through 2029-2030.
- Occasionally spike higher but not sustain levels near the ATH for long.
Bearish long-term risk
Worst case, by 2030:
- Alternative oracle and data solutions become dominant.
- On-chain activity migrates heavily to platforms that do not rely on Chainlink.
- Regulatory or technical setbacks reduce the network’s competitive edge.
In such a scenario, LINK could remain stuck in the low teens or even revisit high single digits, significantly underperforming more successful sectors of the crypto market.
Is Chainlink a Good Investment?
Whether Chainlink is a good investment depends on your risk tolerance, time horizon, and portfolio strategy. Here are key pros and cons.
Investment positives
- Core infrastructure role: Chainlink is deeply integrated into DeFi and other smart contract ecosystems, making it a foundational service provider rather than a niche product.
- First-mover advantage: By building early and forming partnerships, Chainlink has strong brand and network effects among developers.
- Diversified use cases: Beyond price feeds, Chainlink now offers verifiable randomness (VRF), automation (Keepers), CCIP, and more services that expand total addressable market.
- Token utility & staking: LINK is used to incentivize node operators and is increasingly central to staking and security, which could support demand over time.
Investment risks
- Competition: Other oracle projects and new data-layer solutions could erode Chainlink’s market share if they offer cheaper or more performant services.
- Regulatory uncertainty: Rules around tokens, DeFi, and data services may change, impacting Chainlink’s operational model or market access.
- Token economics clarity: Investors still debate how much value accrues to LINK holders versus being absorbed by node operators and the broader ecosystem.
- Volatility: As shown by the -28.35% 1-year move, LINK is still highly volatile and can experience large drawdowns.
For long-term crypto infrastructure exposure, Chainlink is often considered a strong candidate. But prudent investors size positions carefully, diversify, and avoid over-reliance on any single LINK price prediction.
What Experts Say About Chainlink
Analyst and institutional views on Chainlink contribute useful context, though they are not guarantees.
Research and analyst perspectives
- Several crypto research firms highlight Chainlink as a key infrastructure layer in the DeFi stack, often grouping it with leading L1s and L2s as “blue-chip” assets within the crypto economy.
- On-chain analytics platforms have noted that the number of Chainlink integrations and oracle feeds has grown steadily across multiple cycles, indicating persistent developer demand regardless of short-term price action.
Market commentary
- Many long-term-oriented investors emphasize Chainlink’s real-world revenue potential as the DeFi and RWA sectors mature, which can support more fundamental valuation models rather than purely speculative ones.
- Some technical analysts remain cautious due to the token’s underperformance versus some other majors in recent years, viewing it as a “sleeping giant” that must break above key resistance levels before a new secular uptrend is confirmed.
For up-to-date data and charts, you can consult resources such as CoinGecko or CoinMarketCap, and for protocol information see the official Chainlink website.
Factors That Could Affect LINK Price
Any Chainlink price prediction must account for a mix of fundamental, technical, and macro factors.
1. Adoption and integrations
- DeFi growth: More protocols and higher TVL that use Chainlink oracles can increase demand for secure data feeds.
- Cross-chain usage: Adoption of CCIP across major L1s and L2s can cement Chainlink as a core multichain communication layer.
- Enterprise & RWA: Partnerships with banks, institutions, and real-world asset issuers could open new revenue channels.
2. Competition and innovation
- New oracle networks and data providers may undercut Chainlink on price or specialize in certain niches.
- If Chainlink fails to innovate or adapt token economics, it may lose ground to agile competitors.
3. Regulatory environment
- Clear rules for tokens and DeFi can encourage institutional adoption and liquidity.
- Overly restrictive regulations could curb usage in certain jurisdictions, depressing volumes and demand.
4. Tokenomics and staking
- The long-term success of LINK staking and reward mechanisms will influence how much value accrues to token holders.
- High staking participation can reduce liquid supply, which is often cited as supportive of higher prices during demand surges.
5. Macro cycles and risk sentiment
- Interest rates, equity markets, and global risk appetite affect capital flows into crypto as an asset class.
- Periods of risk-off can drag even fundamentally strong projects lower, while risk-on environments may lift all major tokens.
Ready to Trade Chainlink?
Swap LINK instantly on GhostSwap — no KYC, no registration, no hassle. Choose from over 1,500 cryptocurrency pairs and keep full control of your keys with each private, non-custodial exchange.
Frequently Asked Questions
Will Chainlink reach $50 again?
Reclaiming $50 would mean LINK nearly revisits its previous all-time high of $52.70. Our upper 2030 scenario places a potential high around $52, assuming:
- Chainlink continues to dominate the oracle market.
- Staking and protocol revenue gain traction.
- The crypto market sees at least one strong bull cycle by 2030.
There is no guarantee this will happen, but a return to $50 is within the realm of possibility under favorable conditions. Investors should treat such targets as high-end scenarios, not base cases.
Is Chainlink a good long-term investment?
Chainlink is widely considered one of the more fundamentally important crypto projects due to its role in providing secure data to smart contracts. That said, it remains a high-volatility asset that can experience large drawdowns.
If you believe that:
- DeFi, cross-chain applications, and tokenized assets will continue to grow, and
- Chainlink will keep a leading share of the oracle market,
then LINK can be a compelling long-term infrastructure play. As always, diversify, size positions prudently, and avoid investing money you cannot afford to lose.
What will LINK be worth in 2030?
Based on the scenarios outlined in this LINK price prediction:
- 2030 low: $18.00
- 2030 average: $34.00
- 2030 high: $52.00
These numbers are hypothetical ranges, not precise forecasts. Actual price will depend on adoption growth, competition, regulation, and overall crypto market cycles.
Where can I buy/swap Chainlink?
You can obtain LINK on most major centralized exchanges, as well as decentralized exchanges on supported networks. If you prefer a fast, non-custodial option without sign-up, you can swap crypto instantly using GhostSwap.
Just connect a wallet and you can trade LINK against BTC, ETH, USDT and more than 1,500 other coins via the dedicated LINK to BTC swap page, all without KYC or registration.
Is Chainlink better than other oracle or infrastructure coins?
Whether Chainlink is “better” than a competitor depends on what you value:
- Chainlink pros: First-mover advantage, broad integration footprint, diversified services, strong brand among developers.
- Potential competitor pros: Different design trade-offs, alternative tokenomics, or cheaper services for specific niches.
From an investment perspective, Chainlink is often seen as the benchmark oracle asset, but some investors choose to diversify across several infrastructure and oracle projects to hedge against competitive risk.
Is Chainlink better than Bitcoin or Ethereum?
Chainlink, Bitcoin, and Ethereum serve fundamentally different roles:
- Bitcoin (BTC): Primarily a store-of-value and monetary asset.
- Ethereum (ETH): A general-purpose smart contract platform and settlement layer.
- Chainlink (LINK): An oracle network that feeds data into smart contracts across various chains.
Rather than asking which is “better,” many long-term investors hold a combination: BTC as digital gold, ETH as the base smart contract asset, and LINK as core infrastructure exposure. You can rebalance among them quickly using a non-custodial platform like GhostSwap whenever your thesis or risk profile changes.
Ultimately, any LINK price prediction for 2026-2030 should be treated as a scenario map, not a guarantee. Focus on understanding Chainlink’s technology, adoption trajectory, and competitive landscape, and align your investment size and time horizon accordingly.